ACD can be monitored with standard monitoring solutions. This allows you to adapt the monitoring to your needs. The following shows a setup with the following components
- Prometheus as metrics database
- Grafana to create Dashboards
- Alert Manager to create alarms from Prometheus alerts
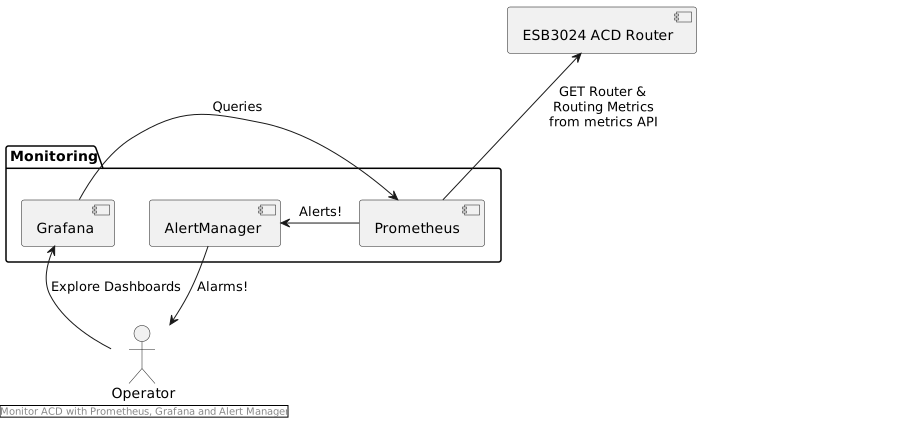
Prometheus and Grafana can also be installed with the ESB3024 CDN Director installer in which case Grafana is also pre-populated with standard routing dashboards as well as the CDN Director troubleshooting Dashboards.