Monitor ACD with Prometheus, Grafana and Alert Manager
Use Prometheus, Grafana and Alert Manager to monitor ACD
ACD can be monitored with standard monitoring solutions. This allows you to adapt the monitoring to your needs. The following shows a setup with the following components
- Prometheus as metrics database
- Grafana to create Dashboards
- Alert Manager to create alarms from Prometheus alerts
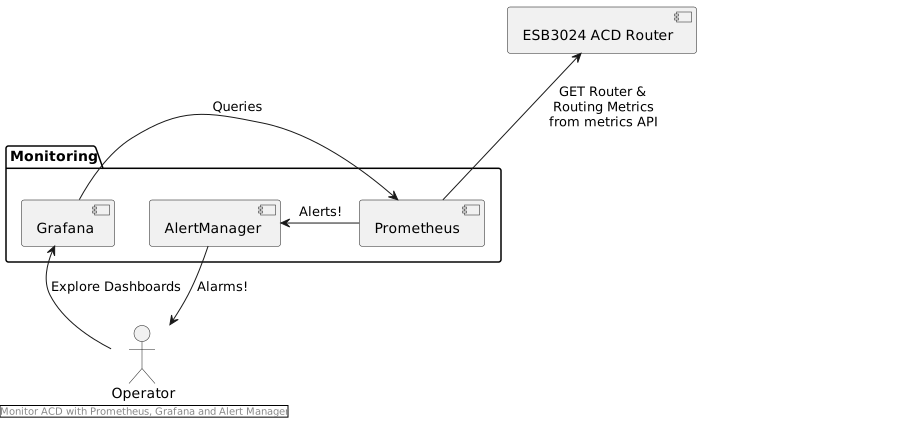
Prometheus and Grafana can also be installed with the ESB3024 CDN Director installer in which case Grafana is also pre-populated with standard routing dashboards as well as the CDN Director troubleshooting Dashboards.